


Bitcoin Price Prediction – December 18
The Bitcoin price rebounds from the early dip at $45,515 as the buying interest may increase on approach to $48,000.
BTC/USD Long-term Trend: Bearish (Daily Chart)
Key levels:
Resistance Levels: $50,000, $52,000, $54,000

Support Levels: $42,000, $40,000, $38,000
BTCUSD – Daily Chart
BTC/USD is moving bearishly as the market establishes a bullish movement towards the 9-day moving average but currently rebounding to retest previous resistance at $47,000. The buyers may continue to look for some resistance levels if it crosses above the 9-day MA and the path of least resistance appears to the upside in the near term amid a favorable bullish technical setup.
Bitcoin Price Prediction: BTC Price May Reclaim $49,000 Resistance
In the past few hours, after the Bitcoin price touches the daily low of $45,515, the king coin is now facing the resistance level of $47,000 and looking forward to reclaiming the resistance level of $48,000. However, the daily chart reveals that if the 9-day moving average remains below the 21-day moving average, this may confirm the next direction that the coin will follow. Therefore, BTC/USD may decline if the $46,000 support breaks down but the price could rise if the $48,000 resistance is reached.
At the time of writing, the technical indicator Relative Strength Index (14) may likely cross above 40-level to indicate a bullish movement. Therefore, if the Bitcoin price crosses above the 9-day and 21-day moving averages, it could hit the resistance levels of $50,000, $52,000, and $54,000 but any movement below lower boundary could hit the supports at $42,000, $40,000, and $38,000.

BTC/USD Medium-Term Trend: Bearish(4H Chart)
According to the 4-hour chart, the Bitcoin price is seen sliding within the 9-day and 21-day moving averages as the technical indicator Relative Strength Index remains below 50-level. From above, if the Bitcoin price moves above the 9-day and 21-day moving averages, the bullish influence could spike and the accrued gains massively.
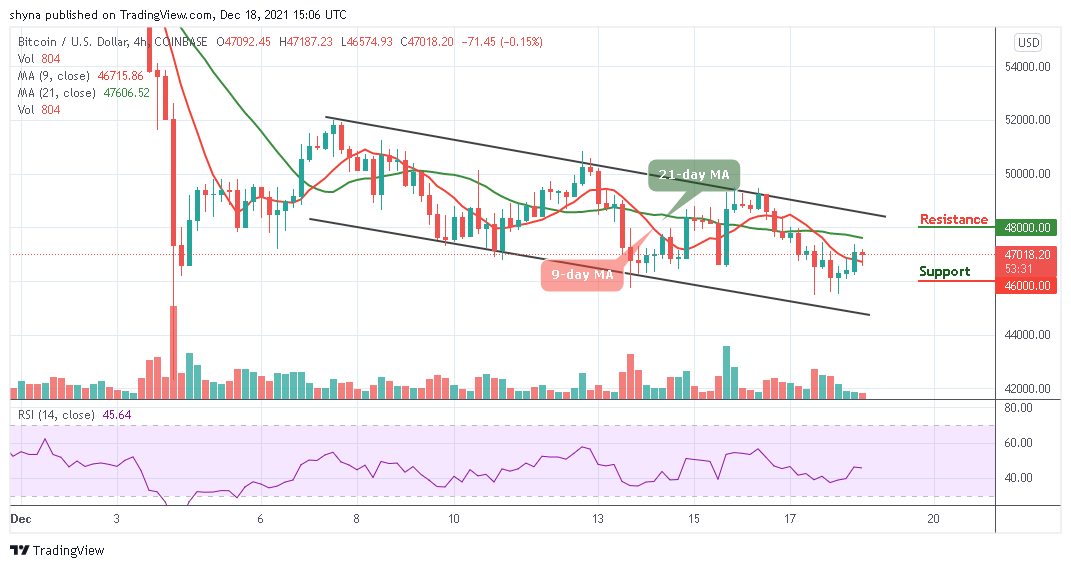
BTCUSD – 4 Hour Chart
However, the current candle could fail and move towards the lower boundary of the channel and the ultimate target could be at $46,000 and below but the best the bulls can do is to hold above the resistance level of $47,000 and keep their attention on breaking the potential resistance at $48,000 and above.
Looking to buy or trade Bitcoin (BTC) now? Invest at eToro!
68% of retail investor accounts lose money when trading CFDs with this provider
Read more:
How to buy BitcoinHow to buy Cryptocurrency


Be the first to comment