
The Bitcoin (BTC) price broke down from an ascending support line while the Crypto Market Cap (TOTALCAP) is close to doing so. MultiversX (EGLD) is invalidating a previous breakout.
In the news today:
TOTALCAP Returns to Support
The cryptocurrency market cap has increased alongside an ascending support trend line since October 2023. Recently, it bounced at the trend line on December 18 (green icon) and began an upward movement.
The bounce led to a new yearly high of $1.73 trillion on January 2, causing a breakout from a critical horizontal and Fib resistance area at $1.60 trillion.

However, TOTALCAP fell sharply yesterday and returned to the $1.60 trillion area and the support trend line again. Whether it bounces or breaks down will likely determine the future trend.
The RSI is a momentum indicator traders use to evaluate whether a market is overbought or oversold and whether to accumulate or sell an asset. Readings above 50 and an upward trend suggest that bulls still have an advantage, while readings below 50 indicate the opposite.
The RSI readings are mixed since the indicator is decreasing but has generated a hidden bullish divergence (green).
A strong bounce can lead to a 16% increase to the next resistance at $1.87 trillion, while a breakdown could cause a 10% drop to the 0.382 Fib retracement support at $1.45 trillion. This will also confirm the breakdown from the ascending support trend line.
Read More: 9 Best AI Crypto Trading Bots to Maximize Your Profits
Bitcoin Breaks Down Below Support Trend Line
Like TOTALCAP, the BTC price has increased alongside an ascending support trend line since October. However, Bitcoin broke down from the ascending support trend line on December 28 and validated it as resistance on January 2 (red icon).
BTC has fallen since but still trades above the long-term 0.5 Fib retracement region at $42,300. This is also a horizontal support area.
Also, in a similar fashion to TOTALCAP, the daily RSI is falling but has generated a hidden bullish divergence. Whether the BTC price bounces or breaks down below $42,300 can determine the future trend.
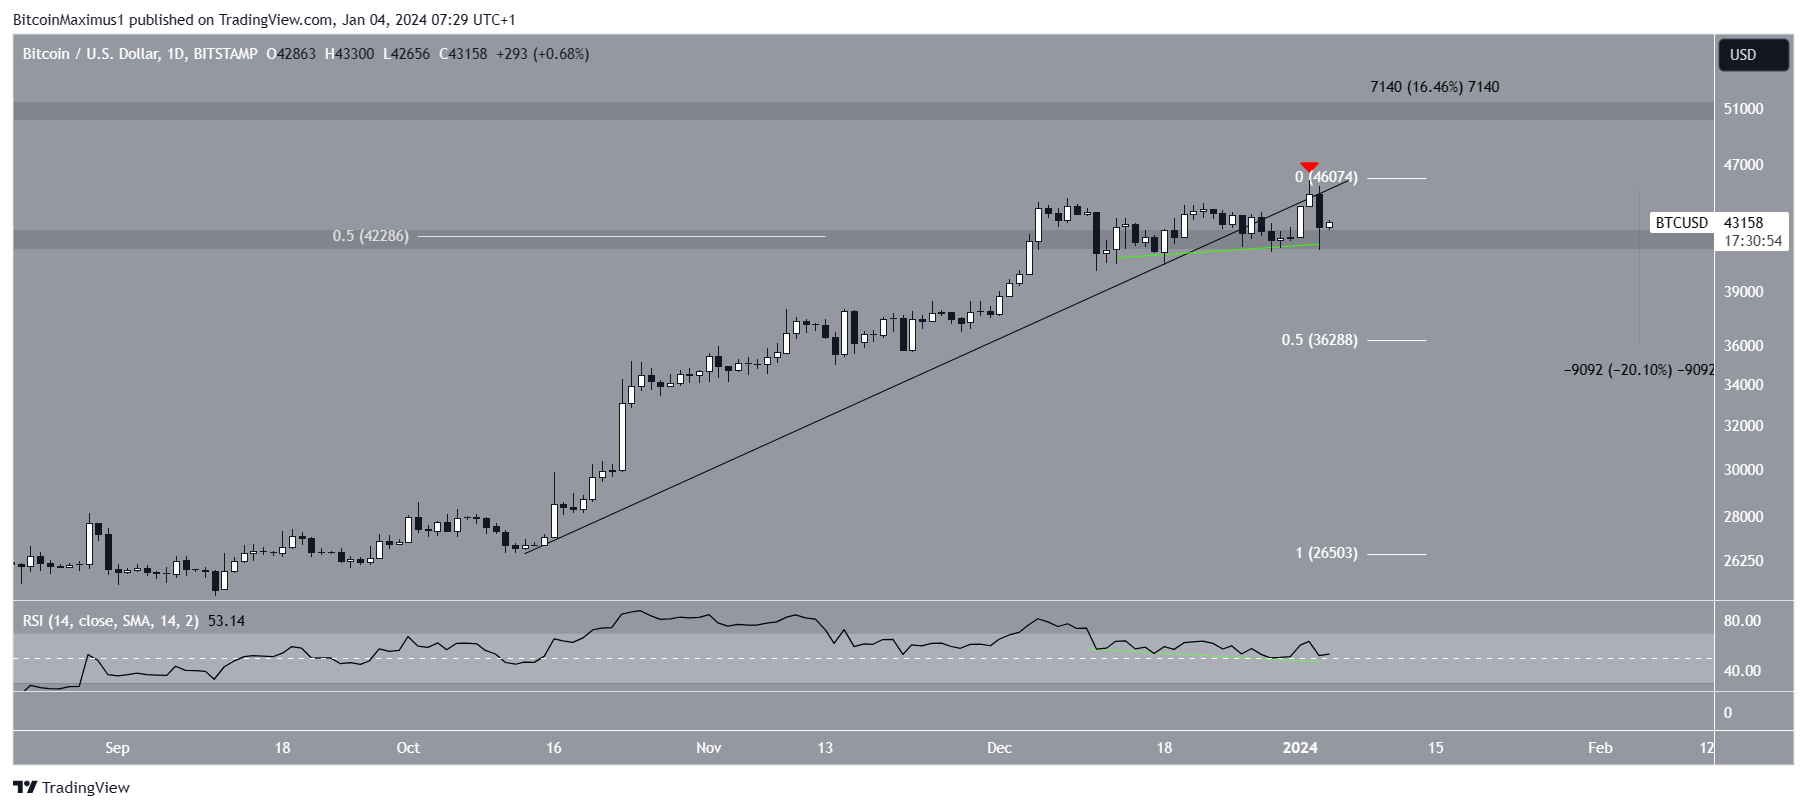
A successful BTC bounce can lead to a 16% increase to the next resistance at $50,500. On the other hand, a breakdown can trigger a 20% drop to the 0.5 Fib retracement support level at $36,300.
Read More: 9 Best Crypto Demo Accounts For Trading
EGLD Falls After Breakout
The EGLD price has increased since breaking out from a descending resistance trend line in October. EGLD reclaimed two horizontal areas at $43 and $63 during the upward trend. This led to a high of $78.10 last week.
However, EGLD fell yesterday and decreased below the $63 horizontal area. This suggests that the previous breakout was only a deviation.
If the downward movement continues, EGLD can fall by another 27% and reach the $43 support area.
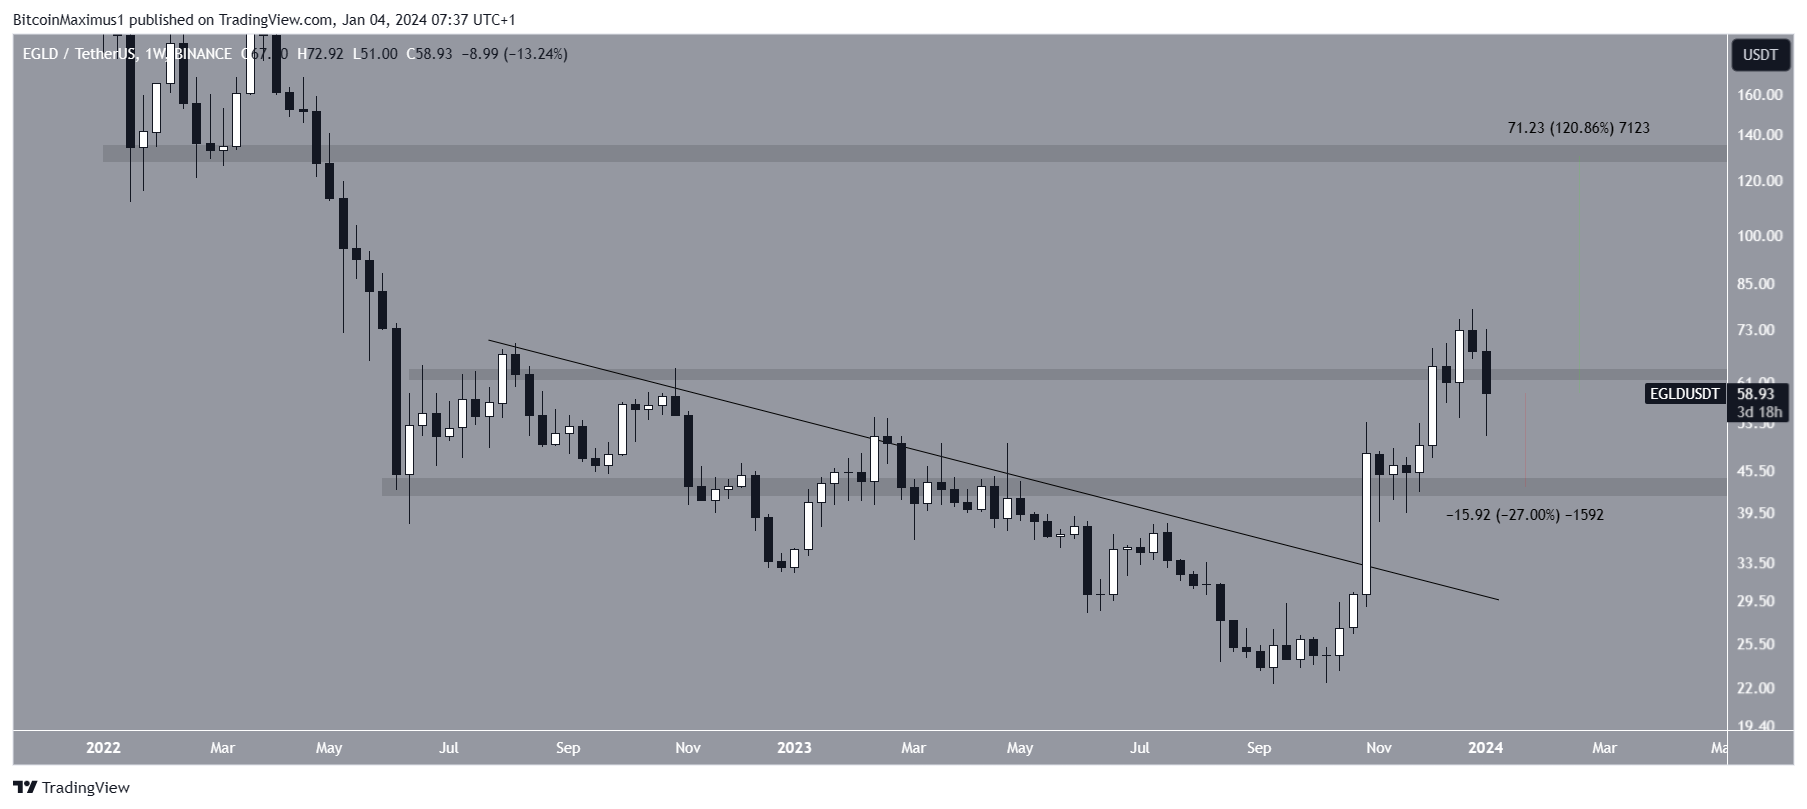
Despite the bearish EGLD price prediction, reclaiming the $63 area can trigger a 120% increase to the next resistance at $130.
Read More: Best Upcoming Airdrops in 2023
For BeInCrypto‘s latest crypto market analysis, click here.
Disclaimer
In line with the Trust Project guidelines, this price analysis article is for informational purposes only and should not be considered financial or investment advice. BeInCrypto is committed to accurate, unbiased reporting, but market conditions are subject to change without notice. Always conduct your own research and consult with a professional before making any financial decisions. Please note that our Terms and Conditions, Privacy Policy, and Disclaimers have been updated.


Be the first to comment